Indian Institute of Management, Ahmedabad
The plots and tables on this page are updated versions of those published in the following paper. Please cite the source of the data as follows:
Agarwalla, S. K., Jacob, J. and Varma, J. R. (2017), Size, Value, and Momentum in Indian Equities, Vikalpa 42.4 (2017): 211-219.
Download BibTex citation
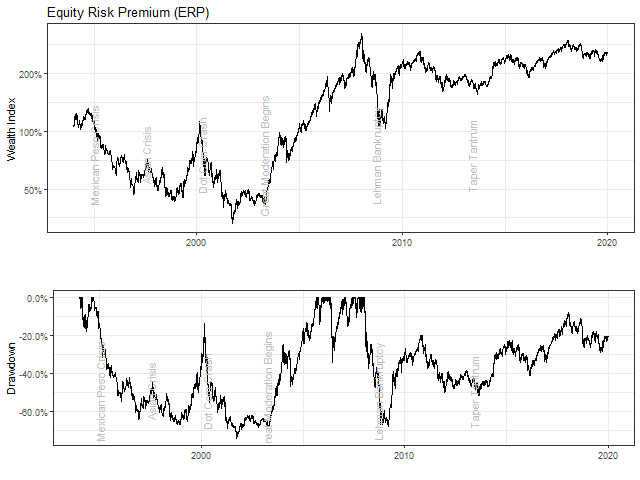
The Equity Risk Premium (ERP) provided an annualized return of 3.70% with an annualized volatility of 21.96%. The worst drawdown was 75.00% and the duration of this drawdown was 11.00 years
| Drawdowns of more than 20% for Equity Risk Premium (ERP) | ||||||||
| Depth | Date | Duration (years) | ||||||
|---|---|---|---|---|---|---|---|---|
| % | From | Trough | To | Total | To Trough | Recovery | ||
| -74.6 | 1994-09-14 | 2001-09-21 | 2005-09-08 | 11.0 | 7.0 | 4.0 | ||
| -68 | 2008-01-08 | 2009-03-09 | NA | 1.2 | NA | |||
| -34 | 2006-05-11 | 2006-06-14 | 2007-01-15 | 0.7 | 0.1 | 0.6 | ||
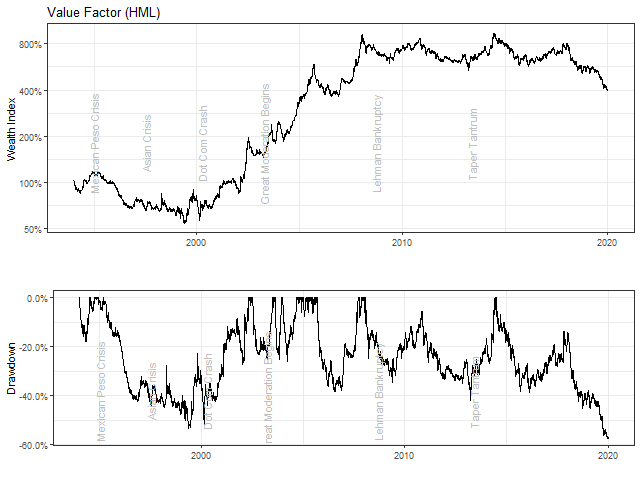
The Value Factor (HML) provided an annualized return of 5.99% with an annualized volatility of 16.37%. The worst drawdown was 57.00% and the duration of this drawdown was 5.50 years
| Drawdowns of more than 20% for Value Factor (HML) | ||||||||
| Depth | Date | Duration (years) | ||||||
|---|---|---|---|---|---|---|---|---|
| % | From | Trough | To | Total | To Trough | Recovery | ||
| -56.9 | 2014-06-10 | 2019-11-14 | NA | 5.4 | NA | |||
| -53.5 | 1995-03-14 | 1999-05-17 | 2002-05-02 | 7.1 | 4.2 | 3.0 | ||
| -41.8 | 2008-01-23 | 2013-03-26 | 2014-06-09 | 6.4 | 5.2 | 1.2 | ||
| -38.4 | 2005-09-19 | 2006-07-25 | 2007-09-17 | 2.0 | 0.8 | 1.1 | ||
| -26.1 | 2003-12-30 | 2004-03-23 | 2004-09-06 | 0.7 | 0.2 | 0.5 | ||
| -25.2 | 2003-08-19 | 2003-11-04 | 2003-12-09 | 0.3 | 0.2 | 0.1 | ||
| -25.2 | 2002-07-09 | 2003-03-26 | 2003-07-02 | 1.0 | 0.7 | 0.3 | ||
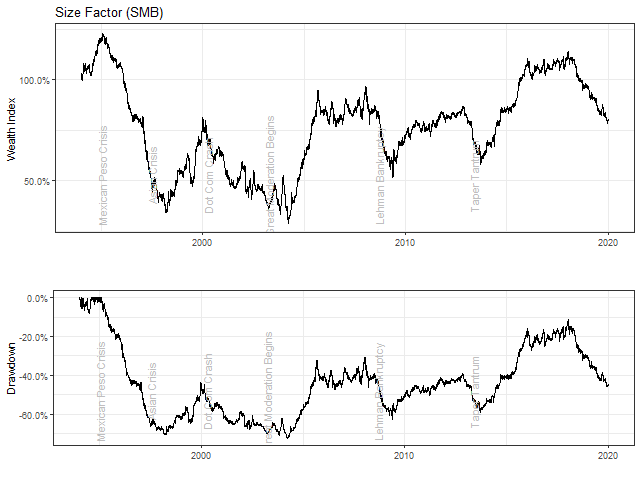
The Size Factor (SMB) provided an annualized return of -1.09% with an annualized volatility of 14.14%. The worst drawdown was 73.00% and the duration of this drawdown was 24.80 years
| Drawdowns of more than 20% for Size Factor (SMB) | ||||||||
| Depth | Date | Duration (years) | ||||||
|---|---|---|---|---|---|---|---|---|
| % | From | Trough | To | Total | To Trough | Recovery | ||
| -72.7 | 1995-01-24 | 2004-03-26 | NA | 9.2 | NA | |||
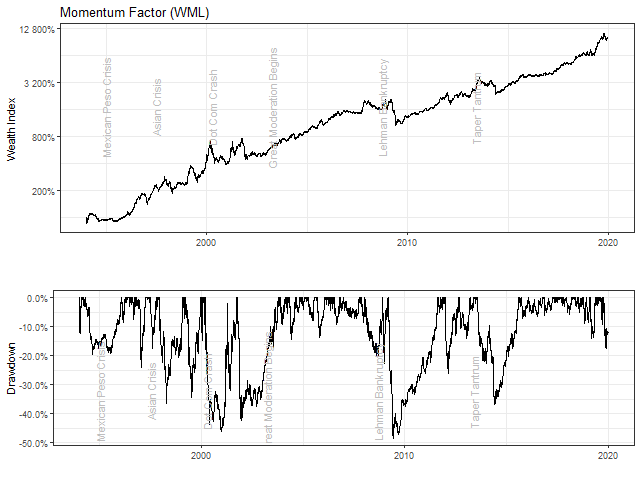
The Momentum Factor (WML) provided an annualized return of 19.18% with an annualized volatility of 16.84%. The worst drawdown was 49.00% and the duration of this drawdown was 2.40 years
| Drawdowns of more than 20% for Momentum Factor (WML) | ||||||||
| Depth | Date | Duration (years) | ||||||
|---|---|---|---|---|---|---|---|---|
| % | From | Trough | To | Total | To Trough | Recovery | ||
| -48.6 | 2009-03-13 | 2009-06-04 | 2011-08-16 | 2.4 | 0.2 | 2.2 | ||
| -46 | 2000-03-08 | 2000-12-28 | 2001-09-21 | 1.5 | 0.8 | 0.7 | ||
| -42.2 | 2001-10-04 | 2001-12-12 | 2003-10-08 | 2.0 | 0.2 | 1.8 | ||
| -37 | 2013-08-05 | 2014-05-23 | 2015-08-20 | 2.0 | 0.8 | 1.2 | ||
| -36.3 | 1997-12-03 | 1998-04-15 | 1999-01-27 | 1.1 | 0.4 | 0.8 | ||
| -34.6 | 1999-03-17 | 1999-07-13 | 1999-12-10 | 0.7 | 0.3 | 0.4 | ||
| -26 | 2012-01-03 | 2012-02-21 | 2012-08-29 | 0.7 | 0.1 | 0.5 | ||
| -24.2 | 1996-10-24 | 1997-01-15 | 1997-04-09 | 0.5 | 0.2 | 0.2 | ||
| -22.7 | 2008-12-03 | 2009-01-05 | 2009-03-05 | 0.3 | 0.1 | 0.2 | ||
| -20.2 | 2008-01-15 | 2008-08-12 | 2008-11-26 | 0.9 | 0.6 | 0.3 | ||